I gave two conference presentations in the past month. The most pressing questions from the audience were:
Are we headed into a recession? When will recession start?
What can be done about the labor shortage?
How can we support all the infrastructure work that is about to begin?
RECESSION
There is no question the sizable drop in starts in 2020 lead to a downturn in construction spending, mostly felt in 2021, but extending somewhat into 2022. However, this quickly turned around for residential spending and nonres bldgs spending is now past the low point caused by the pandemic initiated slowdown. With new construction starts to date at all-time highs and the forecast for new construction starts in the pipeline, it’s hard to envision how this would lead to a construction recession.
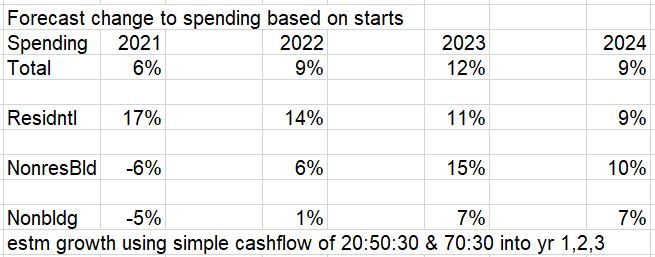
- In 2021, new starts increased 17%. Residential +21%, Nonres Bldgs +15% and Nonbldg +9%.
- In 2022, new starts are forecast up 11%. Residential +10%, Nonres Bldgs +18% and Nonbldg +4%.
- In 2023, new starts are forecast up 10%. Residential +12%, Nonres Bldgs +7% and Nonbldg +11%.
Total of all starts year-to-date in 2022 are up 6% over Jan-May 2021. Nonres bldgs starts are up 17% year-to-date. For the past 6 months, Dec’21 to May’22, residential construction starts posted 5 of the 6 highest months ever. The 6mo total for residential starts is the highest 6mo total ever recorded, up 4% over the previous 6mo record, posted in 2021.
Residential new starts get spent at a ratio of 70:30. Nonresidential Bldgs spending from new starts, on average, gets spent over the next 3 years in the ratio of 20:50:30. That is, 20% of spending from all starts within the year gets spent within the year started, 50% gets spent in the following year and 30% gets spent in the 3rd and sometimes 4th year. So from this we can say, if new starts are up 10% for the year then spending from that source will increase 10% x 20% or 2% the 1st year, 10% x 50%, 5% the 2nd year and 10% x 30%, 3% the 3rd year. If we get 3 consecutive years of growth in new starts there would be no downward pressure on spending for the next 3 to 4 years.
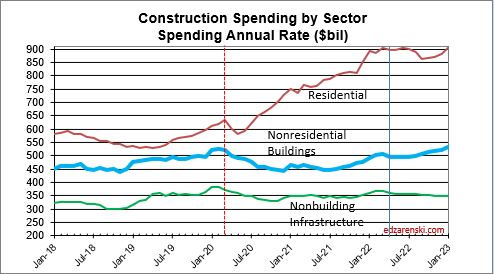
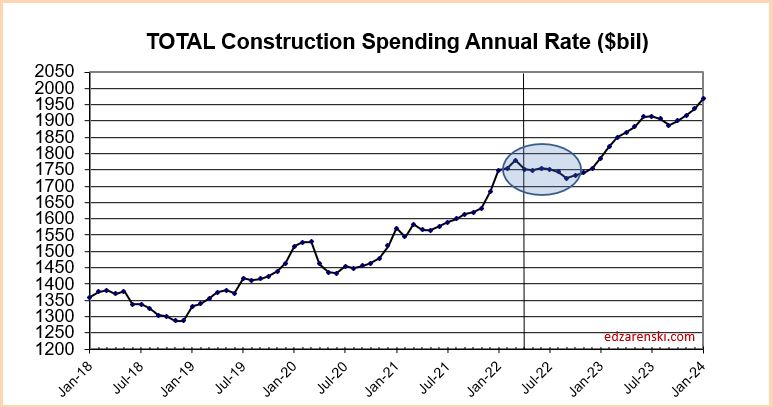
In the 2nd half of 2021, residential starts, although still strong, posted a few lower monthly totals. Although 2022 spending will still finish the year up, these lower monthly starts from late 2021 will work to cause a slight spending dip in the 2nd half of 2022. Nonresidential Bldgs spending is slowly increasing in 2nd half 2022. Nonbldg spending is flat or very slowly decreasing. The net effect is spending will post a decline in 4 of the next 8 months of 2022, but the total declines may not result in 2 consecutive quarters of declines. By the time we head into 2023, all three major construction sectors are in a growth pattern.
So, we will see a few months of spending declines, but the new starts pool of work is growing, not decreasing. The current forecast model is predicting no recession on the horizon.
LABOR SHORTAGE
This next plot shows labor and volume of work (spending minus inflation) to support that labor growing equally, albeit with short-term peaks and troughs, from 2011 to 2018. In fact, this equal growth extends far back with only few years causing exception to this pattern. This plot, and the extension of this plot to older data, shows that normally, labor increases at the same rate as volume. You can see that 2018 posted a significant drop in volume while jobs continued to increase. This departure had nearly corrected itself by Jan 2020.
The most recent construction spending report, issued July 1, revised unadjusted spending data for 2020 and 2021, both years added $30+bil. That brought volume up those years on this plot. The current spread between jobs and volume of work is still 10%.
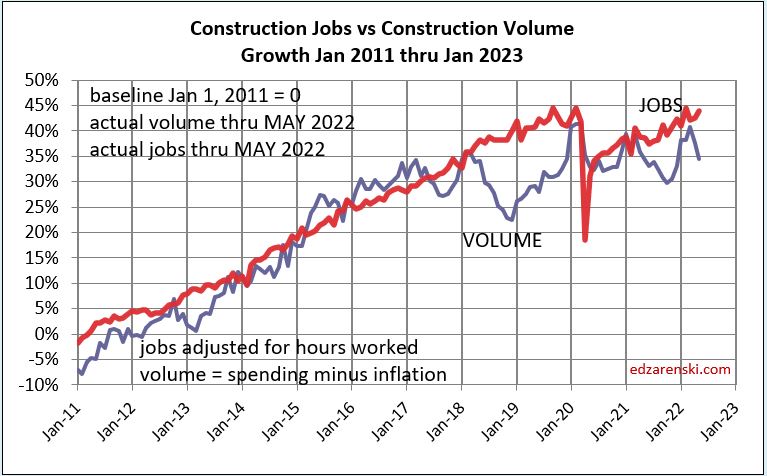
In May of 2020, jobs were already on the rebound, but the volume of work was not. Work volume did recover some at the end of 2020 but then fell again, as was predicted, into mid-2021. In May of 2020, jobs and the volume of work were near balance. Since May of 2020, spending increased by 22%, but most of that was inflation. Since May 2020, actual work volume increased by only 1.5%. Jobs increased by 9%.
The last time the normal jobs/volume growth pattern was disrupted like this was 2006, the only other time in the last 25 years this occurred.
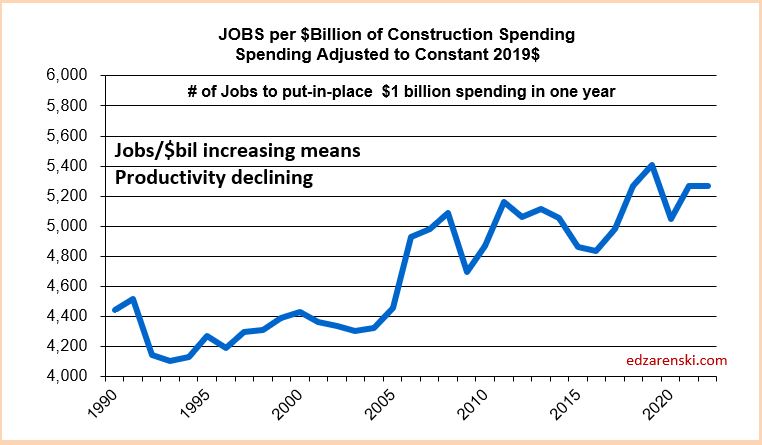
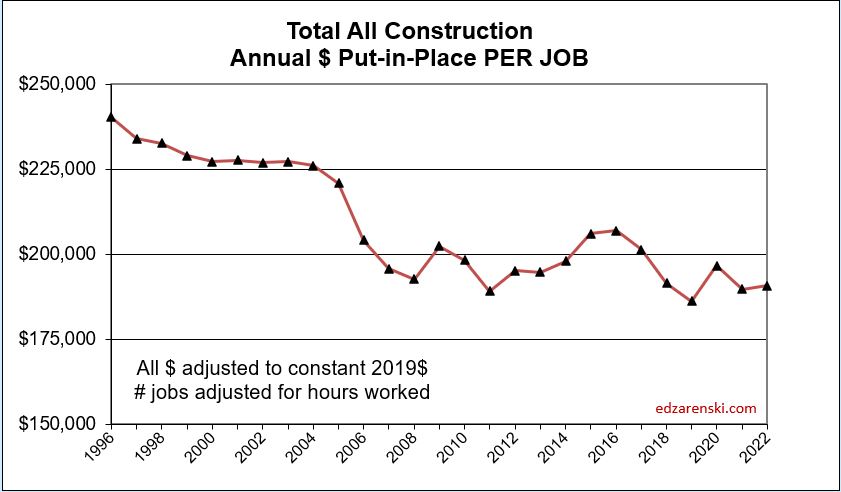
Volume, not spending, supports jobs. If volume is down, support for more jobs drops. If jobs increase while volume is declining then productivity is declining and the number of jobs required to put-in-place $1 billion of construction volume increases. At the same time, the inverse, the amount of volume put-in-place per job, decreases. This productivity loss drives up construction labor cost inflation and the need for additional labor to complete the job.
INFRASTRUCTURE
The current administration has approved an infrastructure spending bill that earmarks approximately $500 billion for construction spending. It will take several years to start all this work.
The infrastructure spending bill may fund construction for a variety of buildings and non-building types of construction, for example, highway, water and sewer, educational, healthcare, etc. Rather than strictly classified as infrastructure, or as commonly referred to as nonbuilding construction, this bill will fund some forms of buildings and non-building construction in the public construction sector.
The total of all public construction is only 25% of all construction. This subset of construction totals about $360 billion in annual construction spending. It has never increased by more than $37 billion in spending ($35 billion in volume) in a year. Average growth is closer to $10-$15 billion/year. This public sector of construction does not have the capacity to increase by $100 billion/year.
As you can see in the plot above, it takes about 5000 jobs to support $1 billion of volume for 1 year. So, increasing volume by $35 billion in one year would require 35 x 5000 = 175,000 new jobs for that year. Keep in mind, this is to support a subset of construction that is only 25% of all construction.
Jobs have never increased by more than 400,000 in one year for all construction. Even taking out the 13 years when jobs dropped, the average jobs growth for the past 50 years is only 220,000/year for all construction. That would seem to indicate the average growth for the public sector, at 25% of all construction, averages only 55,000 jobs/year.
Total all construction for the three years 2022-2023-2024 is forecast to increase $140 billion, $117 billion and $116 billion. The remaining 75% of the construction industry still adds a lot of demand for growth and jobs beyond just that of the public sector that gets a boost from the infrastructure bill. But after adjusting for inflation, the growth in volume over this three-year period is only about $120 billion. That would generate a need to create 600,000 new jobs over the next three years. About 25% of those jobs support the infrastructure funded growth.
If the infrastructure spending bill adds $35-$40 billion/year in spending, $30-$35 billion/year in volume, the need would be 150,000 to 175,000 jobs/year to support that 25% of the construction industry. Since it is unlikely the public sector of construction could add that many jobs, it is more likely the amount of construction added yearly will be somewhat lower.
Infrastructure has a slower spending curve than the 20:50:30 for nonres bldgs, roughly more like 15:40:30:15. If $100 bil of new contract awards start in 2022 then spending would be $15bil in 2022, $40bil in 2023, etc.. At $100bil of new starts per year, the highest one-year growth would be $40bil, probably double the pace the sector can grow.

