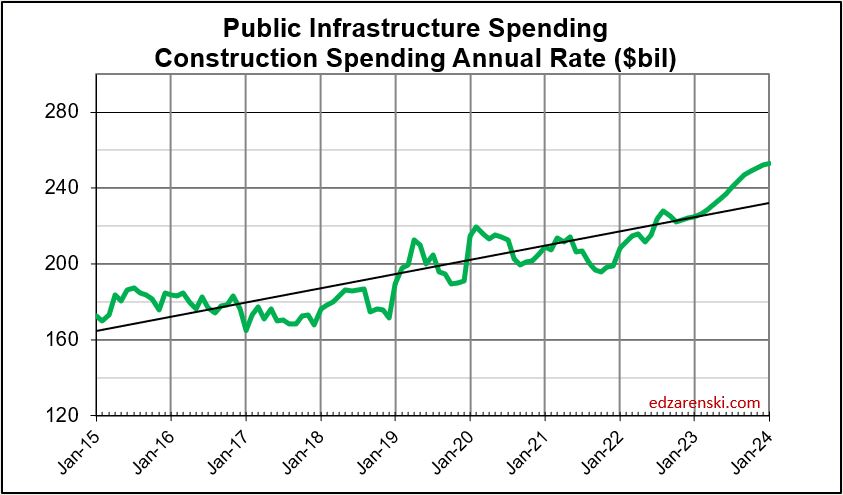
Only once in 25 years have heavy engineering construction jobs increased more than 5% in one year (7.5% in 2018, 72,000 new jobs). Most of the time jobs growth is under 4% (40,000 jobs). Average growth the last 12 years (see notes below) is near 3% or 30,000 jobs per year.
U. S. Bureau of Labor Statistics (BLS) national data shows there are currently 1,078,000 Heavy Engineering jobs. In 2019 there were 1,084,000. There was a loss of nearly 100,000 heavy engineering jobs in early 2020 due to the onset of the pandemic. In 2022, heavy engineering jobs have been nearly constant, just above 1,070,000 the entire year.
Highway/Bridge comprises approximately 30% of all heavy engineering spending, so supports about 300,000 jobs per year.
The current forecast for new construction starts has increased the forecast for spending growth dramatically above previous years. Both starts and spending statistics give an indication of what to expect in the jobs situation. The spending forecast is indicating a need for a large increase in jobs to support the new work. Spending (also consider inflation) is the critical value that determines the need for jobs. Without sufficient jobs, the spending cannot take place. If jobs do not increase to support the forecast spending, the timeline for the spending very likely will get extended.
It takes 400 jobs per year to put in place $100 million of heavy engineering construction in the year. (Some types of work would take 500 jobs, but I’ll work with 400 here). A construction program that hypothetically adds $1 billion of new construction starts in a year would see that work put in place (for Highway work) approximately over the next few years at a ratio similar to a 15:30:35:20 schedule, $150 million the 1st year, $300 million the 2nd year, $350 million the 3rd year and $200 million in the 4th and 5th years. To support $150 million growth in the 1st year would require 600 new jobs. To support an increase of $1 billion in spending in one year would require 4,000 new jobs.
How will the average growth in jobs affect the growth in new starts and forecast spending?
Modeling the new starts forecast, based on the spending schedule outlined above, projects the spending forecast for Highway/Bridge work over the next few years will increase by $15 billion/year. This would indicate a need to add 15 x 4,000 = 60,000 new highway construction jobs each year in 2023, 2024 and 2025. But the entire heavy engineering jobs pool has increased by that amount only once in 25 years and average growth for all heavy engineering jobs is only 20,000 jobs/year. If we take out 2020, when jobs plummeted, the average growth from 2011 to 2022 was 30,000 heavy engineering jobs per year. Keep in mind, highway is only 30% (6,000 to 9,000) of those averages. This indicates it will be very difficult to support spending growth of this magnitude. While the starts projections and resulting spending forecast indicate rapid growth, this market sector has never experienced spending or jobs growth this fast and it is likely that growth will be slower than indicated.
Some of this added work will be absorbed into the existing workforce, backfilling a large deficit in business volume. See this short post Construction Spending – Volume – Jobs Since the Pandemic, nonbuilding construction volume (spending minus inflation) is down 20%, but nonbuilding jobs are down only 1.5%. Compared to 2019, nonresidential construction has an 18% business volume deficit. In other words, Nonres construction in 2022 now has 18% more jobs per volume of work put-in-place than it did in 2019. Total all construction business volume in that period is down 10% while jobs are up 1.5%.
Aside from backfilling volume of work, this shows a shortfall of workers that would likely be needed to support the increased workload. The labor force is insufficient to accommodate that large an annual increase in spending. This could result in one or more of these outcomes: either the workforce must somehow increase faster, or the project spending could slow and duration would get extended, which is more likely.
Jobs shortfall to support 2022-2026 spending identifies unsupported need. If jobs cannot be filled, annual spending will be lower and construction timeline would get extended.
Currently, national construction unemployment rate is near or under 4%. That is an extremely tight jobs market, not an easy growth situation. Typically, when unemployment is in the 6% to 8% range there are workers on the sidelines ready to go right back to work. Unemployment seldom falls below 5%. The current jobs situation and unemployment rate seems to indicate there are few workers ready and available to support an immediate increased workload. This adds to the difficulty of expanding the workforce at a rapid rate.
In this analysis, the potential rate of jobs growth and the current unemployment rate both suggest that the projected rate of spending growth would not be supported. A slower rate of spending leads back to reducing starts.


