Total Construction Spending in 2023 is forecast at $1,960 billion, an increase of 6.0% over 2022.
Nonresidential Buildings spending is leading Construction spending growth.
With nine months in the year-to-date (ytd) for 2023, total all construction spending ytd is up 4.6%. Nonresidential buildings spending is up 22% ytd compared to Jan-Sep 2022. Manufacturing last month was up 72% ytd. I forecast then it would drop to 66% and this month revised that to 67%. Current ytd dropped this month to 70%.
Construction Spending thru Sept. Residential is down 8% ytd. Could add 7% in 2024. Nonresidential Bldgs is up 22% ytd. Expect +6% in 2024 Non-building Infrastr is up 12% ytd and could add another 11% in 2024

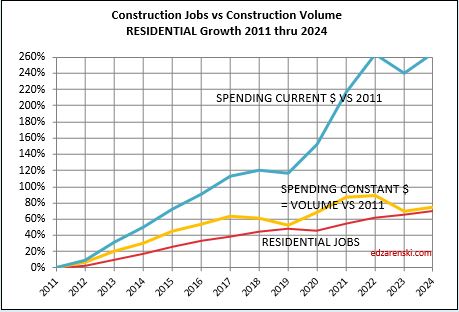
Residential construction spending fell only 8% from Mar’20, the pre-recession high, to May’20, the Covid low. From May’20 to May’22, spending increased 67% to the post-recession high. Since May’22 spending is down 12%.
Manufacturing construction spending, from 2015-2021, averaged $80bil/yr. For 2023-2025, manufacturing constr spending will average $200bil/yr.
Highway spending in 2023 is averaging $130bil and is expected to finish the year at $131bil. That’s up 15% from 2022 and up almost 27% in the last two years. Highway spending is expected to increase 25% over the next two years and may continue upward to a peak spending in 2026.
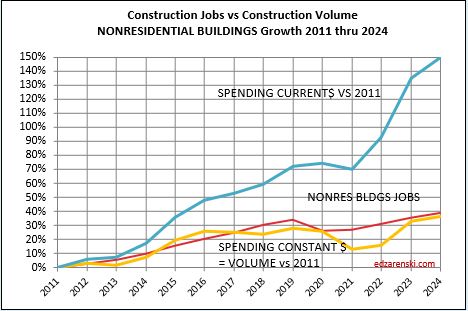
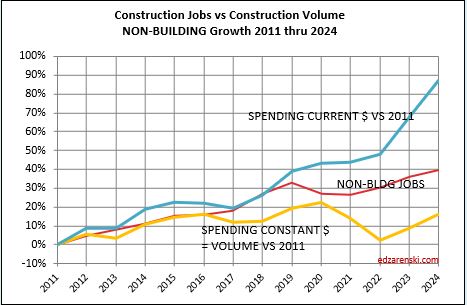
After nearly 8-10 years of fairly well balanced construction volume of work vs jobs, the last 2-4 yrs of volume growth (spending minus inflation) well below jobs, is now coming back into balance. Nonres Bldgs and Non-bldg volume (+11% & +6%) increased to support jobs. Jobs grow steady at 2.8%.
Non-bldg has a ways to go to get to balance. That work volume is on it’s way in the forecast, particularly from Highway and Public Utilities.
Actual residential jobs is probably higher than shown here as there are several issues with capturing all residential jobs.
Sum of all jobs vs Construction volume from 2011-2018 was balanced. In recent years, 2021-2023, jobs grew faster than volume. Nonres is now playing catch-up, volume is increasing faster than jobs..
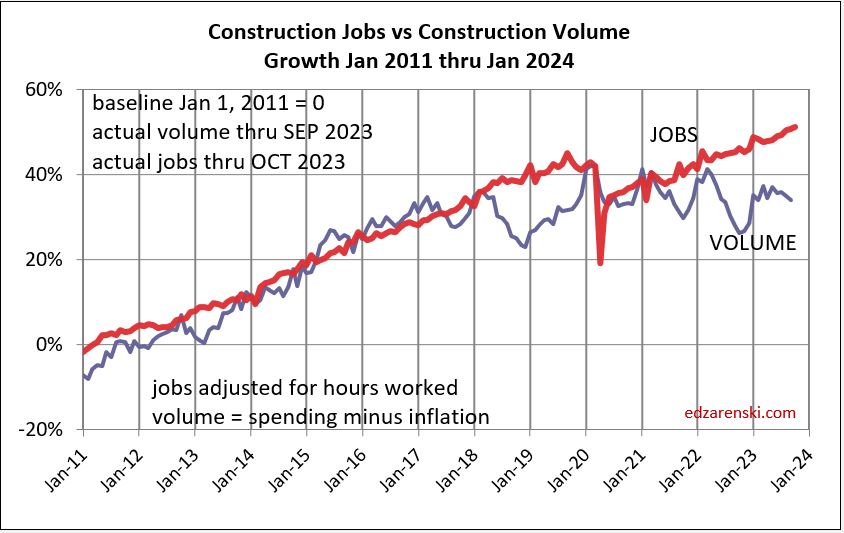
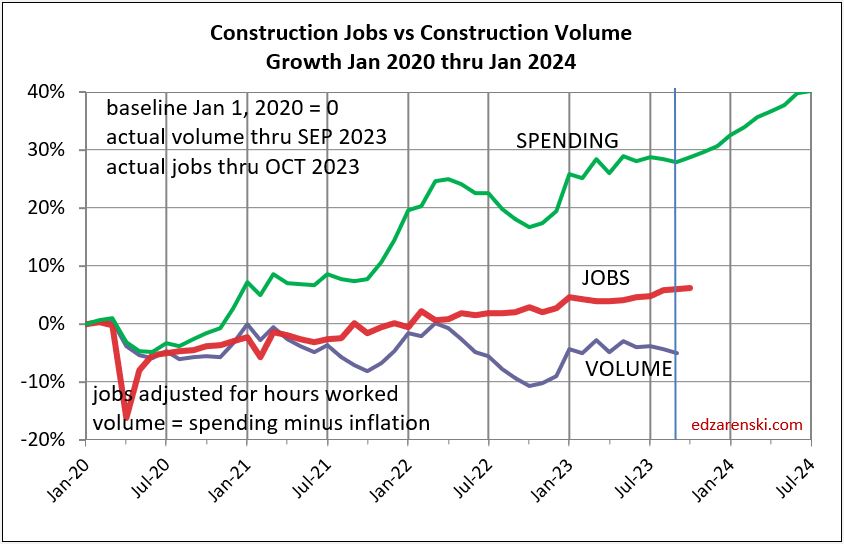
Construction Jobs x hours worked is up 6% since the pre-pandemic high in Q1 2020. Construction volume (spending minus inflation) is down 5.5% since Q1 2020. These two indicators should move in tandem. (See plot above from Jan2011 to Jan2018) When jobs increase faster than the volume of work, productivity is declining.
For 2024 and 2025, volume of work is forecast to increase 3.5% and 4.0%. Most of that gain in 2024 and 2025 is from Non-building Infrastructure forecast growth of 7% and 8%. Jobs increase at a normal rate of 2.5% to 3.0% per year, so this growth in volume will go a long way towards setting jobs vs volume closer to balance.
An indicator I track looks at the predicted final spending (for Nonresidential buildings) for the year based on a projection based on the ytd for the statistically strongest months of the year, AMJJAS. These six months each average annual spending variation from average with standard deviation of less than 0.2%. This subset of annual data has produced an annual forecast within less than 2% variance from actual for 22 years. In fact, in 22 years this forecasting check has varied from actual by greater than 1.5% only twice. The average variation for 22 years is 0.7%. Only once in 22 years has the actual annual spending fell outside the range predicted by the statistically strongest months.
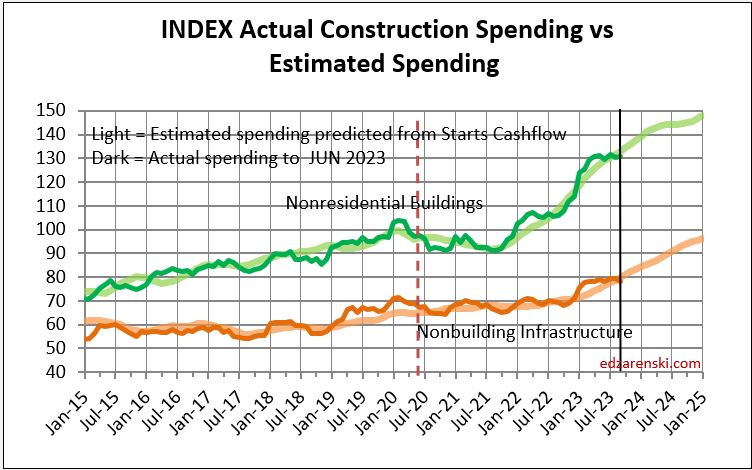
Another indicator I track is the forecast vs the actual spending. This plot shows Nonres Bldgs and Non-bldg Infra forecast vs actual. The track of actual spending is bumpier, but tracks right along with the forecast. My plot for residential was on track until the surge in 2020-2021.